ÕâÆŠÎÄÕÂÖũŌŠ―éÉÜÁËÏę―âĘđÓÃpythonŧæÖÆŧėÏýūØÕóĢĻconfusion_matrixĢĐĢŽÎÄÖÐÍĻđýĘūĀýīúÂë―éÉÜĩÄ·ĮģĢÏęÏļĢŽķÔīóžŌĩÄŅ§Ï°ŧōÕßđĪŨũūßÓÐŌŧķĻĩÄēÎŋžŅ§Ï°žÛÖĩĢŽÐčŌŠĩÄÅóÓŅÃĮÏÂÃæËæŨÅÐĄąāĀīŌŧÆðŅ§Ï°Ņ§Ï°°É
Summary
Éæž°ĩ―·ÖĀāÎĘĖâĢŽÎŌÃĮūģĢÐčŌŠÍĻđýŋÉĘÓŧŊŧėÏýūØÕóĀī·ÖÎöĘĩŅé―áđû―øķøĩÃģöĩũēÎ˞·ĢŽąūÎÄ―éÉÜČįšÎĀûÓÃpythonŧæÖÆŧėÏýūØÕóĢĻconfusion_matrixĢĐĢŽąūÎÄÖŧĖáđĐīúÂëĢŽļøģöąØŌŠŨĒĘÍĄĢ
Code
# -*-coding:utf-8-*-
from sklearn.metrics import confusion_matrix
import matplotlib.pyplot as plt
import numpy as np
#labelsąíĘūÄãēŧÍŽĀāąðĩÄīúšÅĢŽąČČįÕâĀïĩÄdemoÖÐÓÐ13ļöĀāąð
labels = ['A', 'B', 'C', 'F', 'G', 'H', 'I', 'J', 'K', 'L', 'M', 'N', 'O']
'''
ūßĖå―âĘÍŌŧÏÂre_label.txtšÍpr_label.txtÕâÁ―ļöÎÄžþĢŽąČČįÄãÓÐ100ļöŅųąū
ČĨŨöÔĪēâĢŽÕâ100ļöŅųąūÖÐŌŧđēÓÐ10ĀāĢŽÄĮÃīĘŨÏČÕâ100ļöŅųąūĩÄÕæĘĩlabelÄãŌŧķĻ
ĘĮÖŠĩĀĩÄĢŽŌŧđēÓÐ10ļöĀāąðĢŽÓÃ[0,9]ąíĘūĢŽÔōre_label.txtÎÄžþÖÐÓĶļÃÓÐ100
ļöĘýŨÖĢŽĩÚnļöĘýŨÖīúąíĩÄĘĮĩÚnļöŅųąūĩÄÕæĘĩlabelĢĻ100ļöŅųąūŨÔČŧūÍÓÐ100ļö
ĘýŨÖĢĐĄĢ
ÍŽĀíĢŽpr_label.txtĀïÃæŌēÓĶļÃÓÐ1--ļöĘýŨÖĢŽĩÚnļöĘýŨÖīúąíĩÄĘĮĩÚnļöŅųąūūđý
ÄãŅĩÁ·šÃĩÄÍøÂįÔĪēâģöĀīĩÄÔĪēâlabelĄĢ
ÕâŅųĢŽre_label.txtšÍpr_label.txtÕâÁ―ļöÎÄžþ·ÖąðīúąíÁËÄãŅųąūĩÄÕæĘĩlabelšÍÔĪēâlabelĢŽČŧšóķÁĩ―y_truešÍy_predÕâÁ―ļöąäÁŋÖОÆËãšóÃæĩÄŧėÏýūØÕóĄĢĩąČŧĢŽēŧŌŧķĻ·ĮŌŠĘđÓÃÕâÖÖtxtļņĘ―ĩÄÎÄžþķÁČëĩÄ·―Ę―ĢŽÖŧŌŠÄãŨîšó―ŦÄãĩÄÕæĘĩ
labelšÍÔĪēâlabel·ÖąðąĢīæĩ―y_truešÍy_predÕâÁ―ļöąäÁŋÖОīŋÉĄĢ
'''
y_true = np.loadtxt('../Data/re_label.txt')
y_pred = np.loadtxt('../Data/pr_label.txt')
tick_marks = np.array(range(len(labels))) + 0.5
def plot_confusion_matrix(cm, title='Confusion Matrix', cmap=plt.cm.binary):
plt.imshow(cm, interpolation='nearest', cmap=cmap)
plt.title(title)
plt.colorbar()
xlocations = np.array(range(len(labels)))
plt.xticks(xlocations, labels, rotation=90)
plt.yticks(xlocations, labels)
plt.ylabel('True label')
plt.xlabel('Predicted label')
cm = confusion_matrix(y_true, y_pred)
np.set_printoptions(precision=2)
cm_normalized = cm.astype('float') / cm.sum(axis=1)[:, np.newaxis]
print cm_normalized
plt.figure(figsize=(12, 8), dpi=120)
ind_array = np.arange(len(labels))
x, y = np.meshgrid(ind_array, ind_array)
for x_val, y_val in zip(x.flatten(), y.flatten()):
c = cm_normalized[y_val][x_val]
if c > 0.01:
plt.text(x_val, y_val, "%0.2f" % (c,), color='red', fontsize=7, va='center', ha='center')
# offset the tick
plt.gca().set_xticks(tick_marks, minor=True)
plt.gca().set_yticks(tick_marks, minor=True)
plt.gca().xaxis.set_ticks_position('none')
plt.gca().yaxis.set_ticks_position('none')
plt.grid(True, which='minor', linestyle='-')
plt.gcf().subplots_adjust(bottom=0.15)
plot_confusion_matrix(cm_normalized, title='Normalized confusion matrix')
# show confusion matrix
plt.savefig('../Data/confusion_matrix.png', format='png')
plt.show()
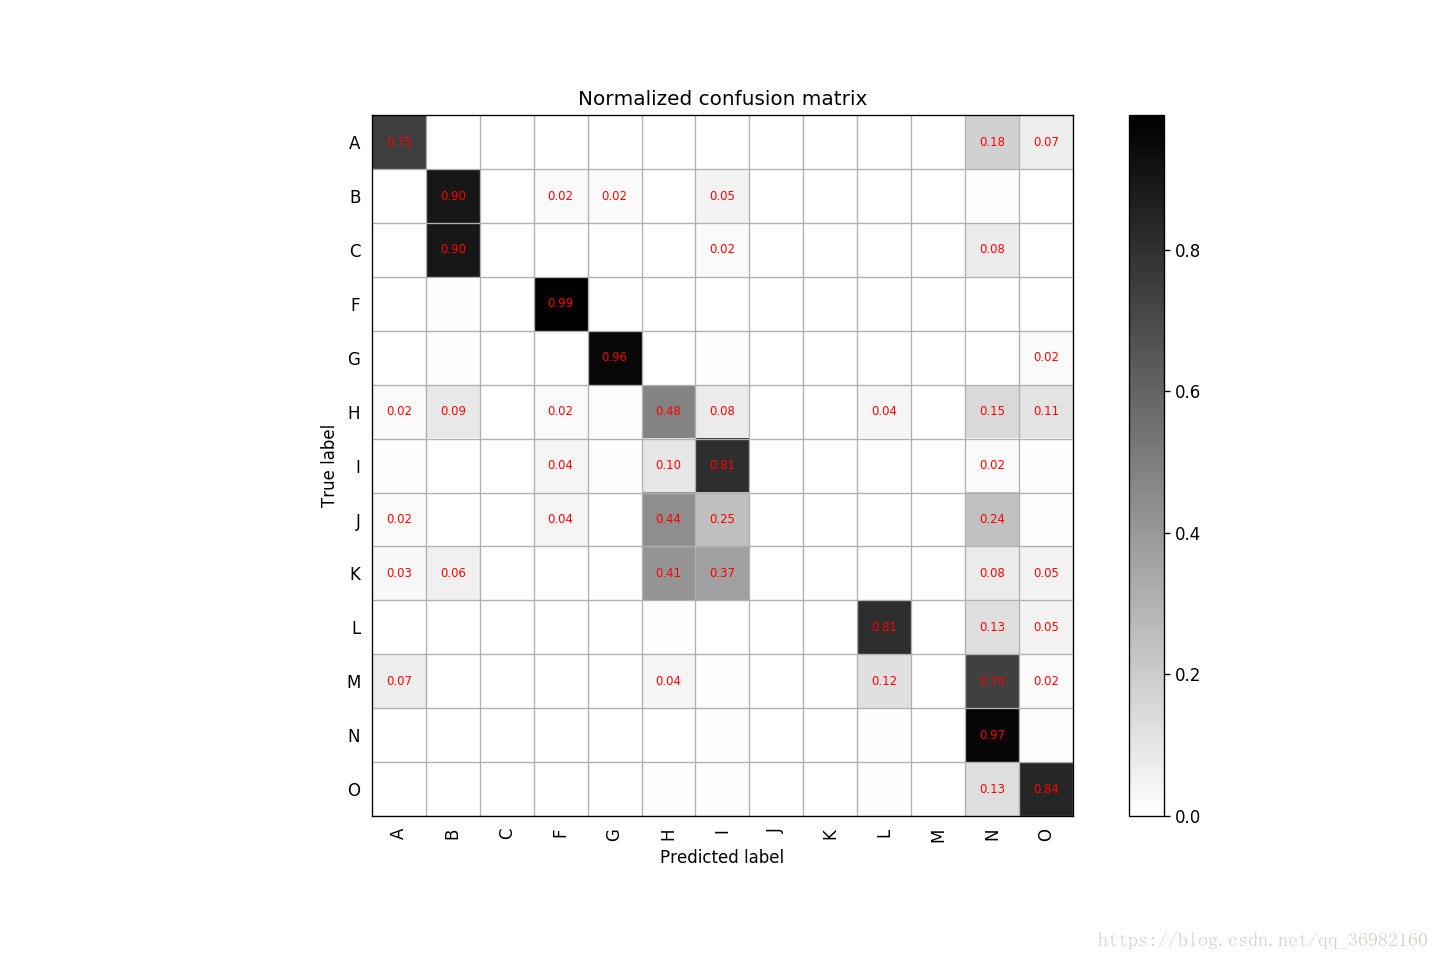
Result
ŌÔÉÏūÍĘĮąūÎÄĩÄČŦēŋÄÚČÝĢŽÏĢÍûķÔīóžŌĩÄŅ§Ï°ÓÐËų°ïÖúĢŽŌēÏĢÍûīóžŌķāķāÖ§ģÖ | 


